
Understanding Text Data to Help Disadvantaged Families
To find patterns in text data to better understand the shared experiences of vulnerable families and youth
Understanding Text Data to Help Disadvantaged Families Read More »
To find patterns in text data to better understand the shared experiences of vulnerable families and youth
Understanding Text Data to Help Disadvantaged Families Read More »
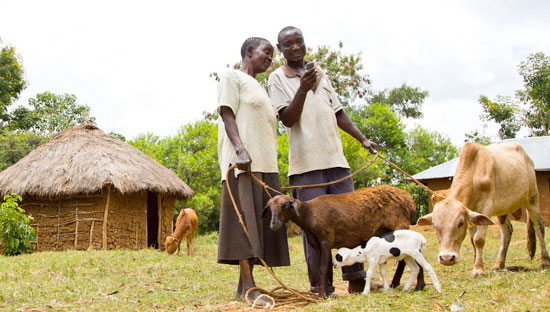
Automate a data-driven process for targeting villages to receive cash transfers.
Use satellite imagery and machine learning to identify, on a village-by-village level, the proportion of thatch and metal roofed homes, with thatch as a proxy for extreme poverty.
Using Satellite Imagery to Find Villages In Need Read More »
Look for patterns in temperature failures—specific clinics, types of refrigerators, and more—to identify which clinics could most stand to benefit from opportunities for improvement.
Help Nexleaf improve the cold chain supply to deliver more unspoiled life-saving vaccines to people in need
Get additional insight into how data analysis can be improved in the future to help Nexleaf achieve their impact
Keeping It Cool: Using Mobile Technology To Preserve Vaccines Read More »

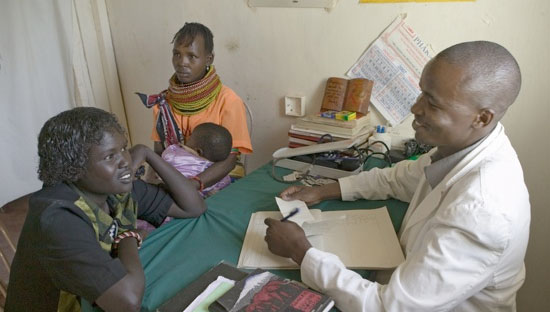
Examine counselor and teen text exchanges to help counselors more effectively serve teens in crisis.
Help counselors understand what factors could improve positive outcomes.
Recognize patterns to allow Crisis Text Line volunteers to respond faster to potentially harmful situations and interact more effectively with teens in crisis.
Learning From Text Messages To Help Teens in Crisis Read More »

Predict future human rights violations based on Amnesty International’s decades of carefully tracked Urgent Action alerts.
Connect human rights supporters with information and each other to swiftly take coordinated action where they are needed most.
Predicting And Preventing Human Rights Abuses Read More »

Create an affinity score metric that demonstrates how swayable specific elected officials—how quickly and strongly that official aligns behavior to the special interests providing funding.
Track how official positions change over time—via a bill’s language as it goes through the legislative process—to gauge the influence of special interests.
Build simple visual models that reveal the inner workings of our legislative process and its consequences.
Let The Sun Shine On Politics Read More »

Determine if real-time data sources can take some of the guessing out of inflation rates.
Identify price data at sub-national levels that could enhance inflation calculations.
Create a “defining chart” to further refine inflation calculations and improve monetary policy reactions.
Scraping Websites To Collect Consumption And Price Data Read More »

Visualize nighttime illumination history over interesting and relevant datadriven maps.
Find out if there is a connection between poverty and nighttime illusion that might be helpful in addressing poverty.
Create a model for building other data relationships that offer the opportunity to react quickly to surging poverty.
Shining a Light on Poverty Read More »

Create an interactive databook to replace the traditional PDF factsheet, collecting crunched data on the indicators that have an impact on poverty.
Present data on DC’s state of child well-being to child advocates, policymakers, and curious citizens using robust visualizations that incite action.
Mapping Poverty To Beat It Read More »

Find evidence that the increased frequency of pruning has substantial benefits.
Determine what tree species make the most sense for future plantings to minimize risk.
Affirm the value in gathering and analyzing such data.
Out On a Limb – For Data Read More »